
Jonmichael Hands, Sr. Director Product Planning
Introduction
Hyperscale data centers increasingly leverage NVMe power states to manage the Thermal Design Power (TDP) of SSDs, aiming to reduce cooling requirements while optimizing Total Cost of Ownership (TCO). The best indicator of SSD energy efficiency—gauged by performance per watt—can be found in the synergy between innovative controller architectures and advanced NAND technology. Adding to the problem, PCIe 5.0 and 6.0 are creating an even more significant energy challenge for SSDs as performance expectations increase.
FADU has developed a highly innovative architecture built from RISC-V low-power CPUs and a programmable control plane. This design can bypass the traditional bottlenecks imposed by CPU cores in the IO path. The architecture increases power efficiency and improves performance, alleviating any controller performance bottlenecks.
These advancements in energy efficiency typically translate into significant TCO savings, fostering more sustainable data center design. Due to the growing impact of AI, energy in data centers is depleting rapidly, so embracing new levers to reduce energy consumption has become incredibly important.
Power Efficiency Disparities: Data Center vs. Consumer SSDs
While both server and consumer SSDs leverage the same media (NAND flash) and interfaces (PCIe, NVMe), their power efficiency profiles differ significantly due to distinct usage patterns and design priorities.
Data Center SSDs: Optimized for continuous workloads and steady-state performance, server SSDs are engineered to operate under heavy workloads continuously, often maintaining high utilization rates 24/7. Power can be efficiently managed by NVMe power states to cap the drive’s TDP. The critical power efficiency metric is performance per watt in the active state and idle active (low latency resume).
Performance per W in the active state is today’s key metric for data center power efficiency.
Consumer SSDs on the other hand, found in laptops and desktops, which typically experience bursty workloads followed by extended idle times (gaming, content creation, office productivity). This necessitates SSDs that can deliver responsive performance during active use while minimizing power consumption during idle periods. Consumer SSDs employ SLC (Single-Level Cell) caching to maximize performance during these bursty workloads, and move data to TLC or QLC during idle time. Consumer SSDs use technology like NVMe autonomous power state transitions and PCIe L1.2 to deliver near-zero idle power.
Understanding these differences is crucial for selecting the right SSD In large data centers. Where SSDs operate continuously, the performance per watt of server SSDs becomes key to optimizing TCO. The 10ms of resume latency, which can be found from zero idle power can have a massive impact on data center workloads. Data center drives have power loss protection which also complicates the zero idle power states.
Innovative Controller Architectures
FADU has introduced the first production RISC-V controller. The FADU controller has a mix of hardware offloads in the ASIC as well as pipelined operations from lower power RISC-V cores. The FADU design has overcome traditional limitations of CPU-bound I/O paths. Gone are the paths that require CPU core frequency scaling and more cores as the only means of achieving higher IOPS. The architecture enables both higher performance and lower power consumption.
The FADU Echo controller consumes only 5.7W maximum while optimizing workloads. The SSD total power budget is capped by the physical form factor (e.g., 25W for U.2) or limited by the end-user using NVMe power states to optimize the thermal profile. The E1.S spec also offers recommendations for each heat sink variant.
| Parameter | E1.S (5.9 mm) | E1.S (8.01 mm) | E1.S (9.5 mm) | E1.S (15/25 mm) |
| 12Vpsus | 12 W | 16 W | 20 W | 25 W |
If we look at the power budget of an SSD, the overwhelming majority of the power goes to the controller and the NAND. If you take a look at the total SSD power budget, and look at the percentage of power that the controller uses vs the NAND, you can see an interesting trend: the higher a controller’s power consumption, the more performance loss and reduction in performance and power efficiency when the total power budget is capped. For example, consider comparing Echo, 5.7W active, to a competitor 16 channel PCIe 5.0 controller at 8.5W. If you cap the power needed for hyperscalers to run at optimal TCO, the percentage allocated to NAND is directly proportional to the controller’s active power.
Move the slider down to 10W to see what happens to the percentage power on the NAND!
You can see with an NVMe identify controller command which power states the drive supports. This 3.84TB drive won’t consume more than 18.4W uncapped in any workload, so operationally power states 0,1 and 2 are identical. Many hyperscalers want to run an E1.S SSD at 14W for 3.84TB and 16W for 7.68TB (per OCP NVMe DSSD spec).
nvme id-ctrl /dev/nvme0n1 -H

ps      0 : mp:35.00W operational enlat:100000 exlat:100000 rrt:0 rrl:0
            rwt:0 rwl:0 idle_power:- active_power:-
            active_power_workload:-
ps      1 : mp:25.00W operational enlat:100000 exlat:100000 rrt:0 rrl:0
            rwt:0 rwl:0 idle_power:- active_power:-
            active_power_workload:-
ps      2 : mp:20.00W operational enlat:100000 exlat:100000 rrt:0 rrl:0
            rwt:0 rwl:0 idle_power:- active_power:-
            active_power_workload:-
ps      3 : mp:18.00W operational enlat:100000 exlat:100000 rrt:0 rrl:0
            rwt:0 rwl:0 idle_power:- active_power:-
            active_power_workload:-
ps      4 : mp:16.00W operational enlat:100000 exlat:100000 rrt:0 rrl:0
            rwt:0 rwl:0 idle_power:- active_power:-
            active_power_workload:-
ps      5 : mp:14.00W operational enlat:100000 exlat:100000 rrt:0 rrl:0
            rwt:0 rwl:0 idle_power:- active_power:-
            active_power_workload:-
ps      6 : mp:12.00W operational enlat:100000 exlat:100000 rrt:0 rrl:0
            rwt:0 rwl:0 idle_power:- active_power:-
            active_power_workload:-
ps      7 : mp:10.00W operational enlat:100000 exlat:100000 rrt:0 rrl:0
            rwt:0 rwl:0 idle_power:- active_power:-
            active_power_workload:-
ps      8 : mp:8.25W operational enlat:100000 exlat:100000 rrt:0 rrl:0
            rwt:0 rwl:0 idle_power:- active_power:-
            active_power_workload:-
If we want to check what power state the drive is in
nvme get-feature /dev/nvme0 -f 2 -s 0And to set it to power state 0 (unthrottled performance)
nvme set-feature /dev/nvme0 -f 0x2 -v 0 -sMeasured Results
Power efficiency is measured in performance per W, either IOPS or throughput per W. Let’s measure the performance and power of the FADU Echo drive vs. the leading 16 channel competitor. Not only is the absolute performance better, but Fadu Echo is able to deliver it with considerably less power. The power efficiency in the table below is at uncapped and unthrottled performance, as we discussed in the previous section, the power efficiency gain is even greater when the total drive TDP is capped by setting an NVMe active power state. The performance workloads must be run again to get an accurate power efficiency delta when comparing.
Throughput in MB/s, IOPS in kIOPS. Measured by Fadu, system config in Appendix
Drive Power Efficiency Impact on Server Power
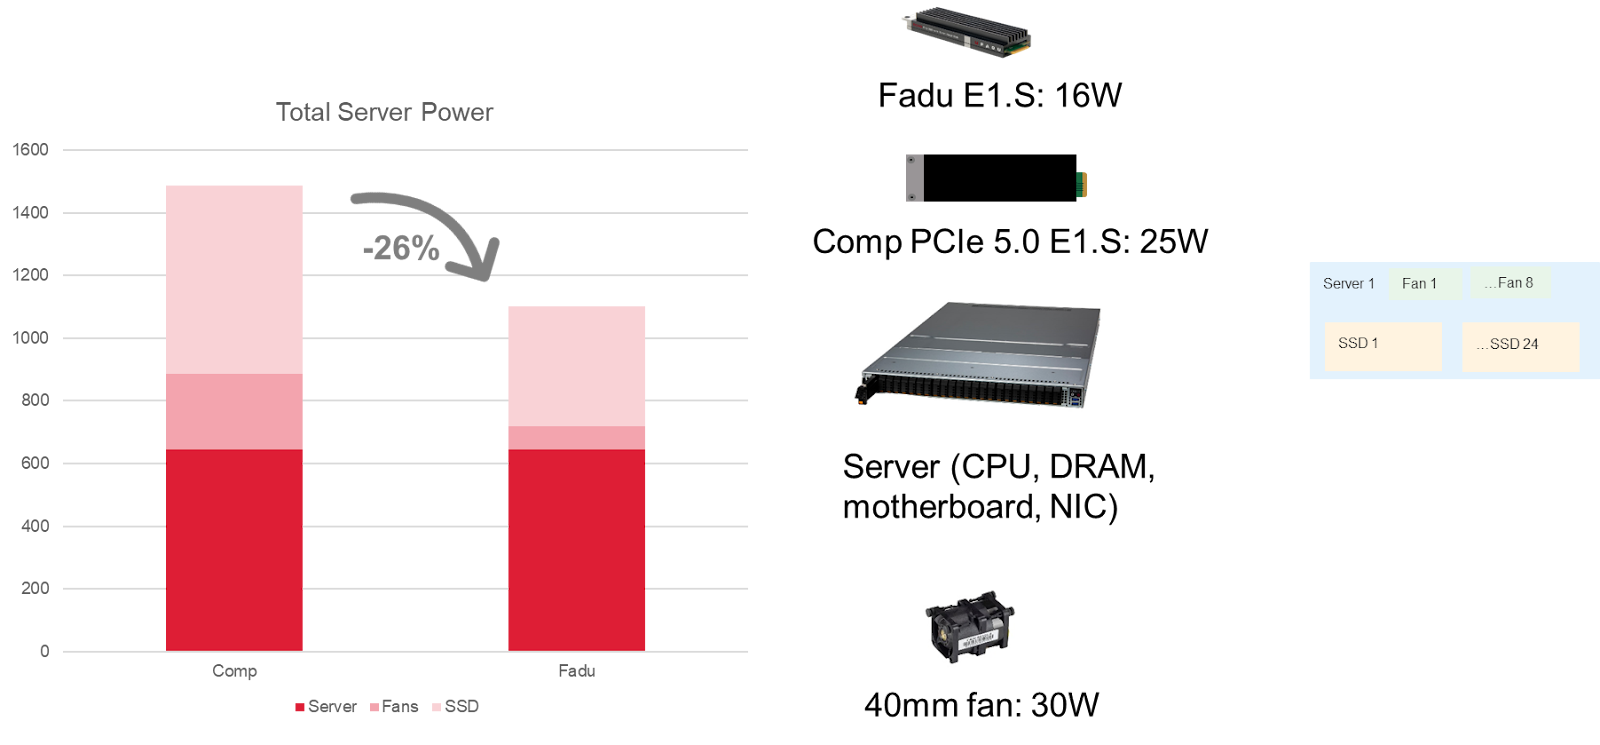
It is not obvious at first that reducing the power of the SSD by a few W would have a meaningful impact on server-level total power consumption. CPUs and GPUs are now consuming hundreds of watts of power. We take a simple example of a Supermicro Storage SuperServer SSG-121E-NES24R which has support for 24 front hot-swap E1.S NVMe drive bays.
As discussed above, FADU Echo E1.S can deliver over 2x the energy efficiency in something like random read at 16W TDP vs a drive that was optimized for 25W. If we use 24 of them in a server we can observe the power delta: (25 – 16) x 24 = 216W.
What is not obvious is a large amount of the server power goes to keeping this 1U server cool. These 40mm fans, notorious for being insanely loud, can consume 30W while active. The fans ramp up to the hottest components in the server, meaning they could ramp to 100% with the SSDs active even if the CPU isn’t fully being utilized. Combining the fan speed power savings with the SSD power savings, we can reduce the server power by up to 26% in a storage server configuration of 24 E1.S SSDs.
Drive Power Efficiency Impact to Rack Level TCO
So we have some impressive server-level power savings, but how much does that actually save us on data center TCO, which includes power, rackspace, cooling, and networking? Let’s take an example rack that is power limited by the PDUs, which are run at the recommended 80% of max load. Two 50A PDUs in A/A power configuration (no redundancy) can yield around 15kW of power to the IT equipment. If we pop the configuration into the SNIA TCO model we can see that at the lower server power we can fit 45% more servers in the rack while running the drives at 16W vs 25W TDP. This, with the OpEx reduction from the power, reduces $TCO/TB raw by up to 29%.
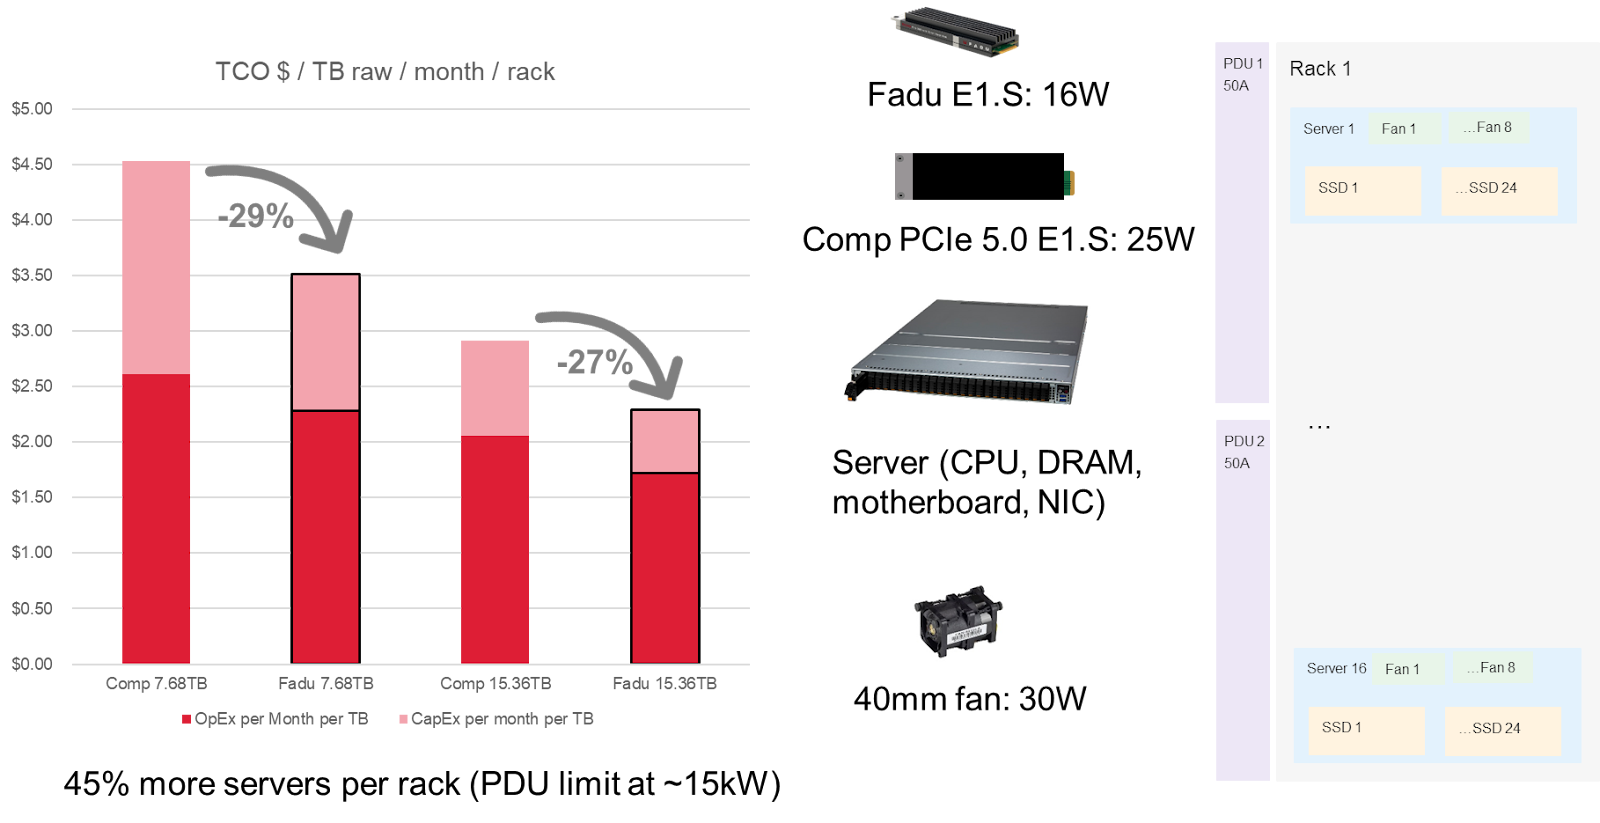
Source: Fado TCO model
Quantifying the Impact: Sustainability vs Energy Efficiency
Confusing efficiency and sustainability is a common mistake in the ICT industry. Efficiency is an essential aspect of sustainability and making data centers and products more efficient reduces energy consumption. Still, it is only one aspect of a sustainability strategy. Transparency of reporting and metrics, circularity, and interoperability are key categories of sustainability beyond efficiency.
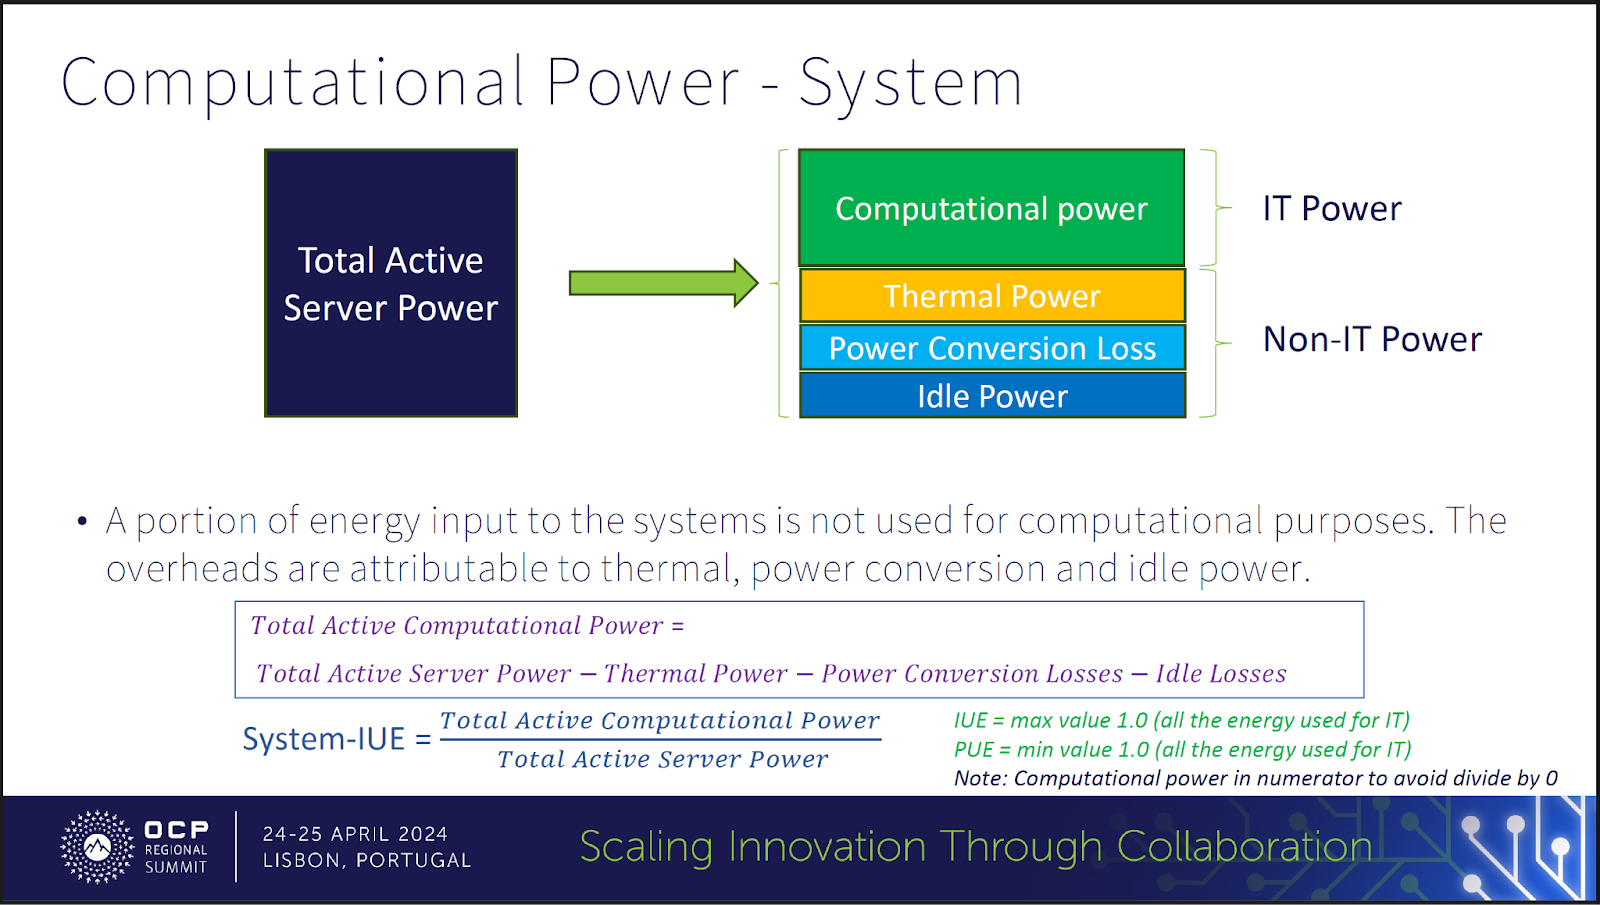
The Open Compute Project (OCP) emphasizes efficiency as a core tenet of sustainability, recognizing its potential to reduce energy consumption and environmental impact. Efficiency is extremely important and is its own OCP tenet. However, existing metrics like Power Utilization Effectiveness (PUE), while effective in optimizing data center cooling, still need to fully capture the carbon intensity of power sources or the most efficient use of IT power.
To address this, the OCP is actively involved in developing and promoting new IT efficiency metrics. At the OCP Regional Summit this year Intel had a presentation on one of the new IT metrics, the Infrastructure Utilization Efficiency (IUE) metric to classify energy consumed at system and rack level that distinguishes between compute vs non-compute power.
At the product level, efficiency improvements can be quantified relative to industry averages or previous product generations. Life Cycle Assessments (LCAs) offer a comprehensive way to document energy efficiency, by highlighting energy use and associated greenhouse gas emissions across different lifecycle phases.
With greater emphasis on energy efficiency, the industry can achieve “more with fewer” servers, reducing Scope 3 emissions associated with manufacturing and product use. However, as the OCP Sustainability Whitepaper emphasizes, caution should be exercised when comparing sustainability claims, by adhering to guidelines like the FTC Green Guides to ensure responsible and accurate communication.
Energy efficiency is a key sustainability driver of the use phase! Small changes in component power can have a massive impact to rack-level density and IUE.
Conclusion
The multi-faceted pursuit of energy efficiency in hyperscale data centers is a challenge that requires a holistic approach. While advancements in NAND technology contribute to overall efficiency, the role of SSD controllers is increasingly pivotal. Innovative controller architectures are proving to be instrumental in reducing SSD power consumption and maximizing performance per watt.
FADU’s Echo controller, with its impressive power efficiency and performance gains, exemplifies the benefits of these new architectures. By significantly reducing controller power consumption, Echo not only improves the energy efficiency of individual SSDs but also unlocks substantial TCO savings at the server and rack levels
System Configuration for Performance Benchmarks
| CPU | 13th Gen Intel(R) Core(TM) i5-13600K |
| Main Board | ASRock Z790 |
| OS | Ubuntu 22.04.2 LTS |
| Kernel | 6.2.10 |
| Tool | fio 3.35 |
Sequential Performance
Thread Count = 1, Queue Depth = 1~256, IO Size = 4~1024KB.
Random Performance
Thread Count = 1, 8, Queue Depth = 1~256, IO Size = 4KB, Sustained Performance.
Power consumption
Quarch PPM+, Operating voltage : 12V, Power resolution : (sampling rate) 2ms, (window size) 500ms